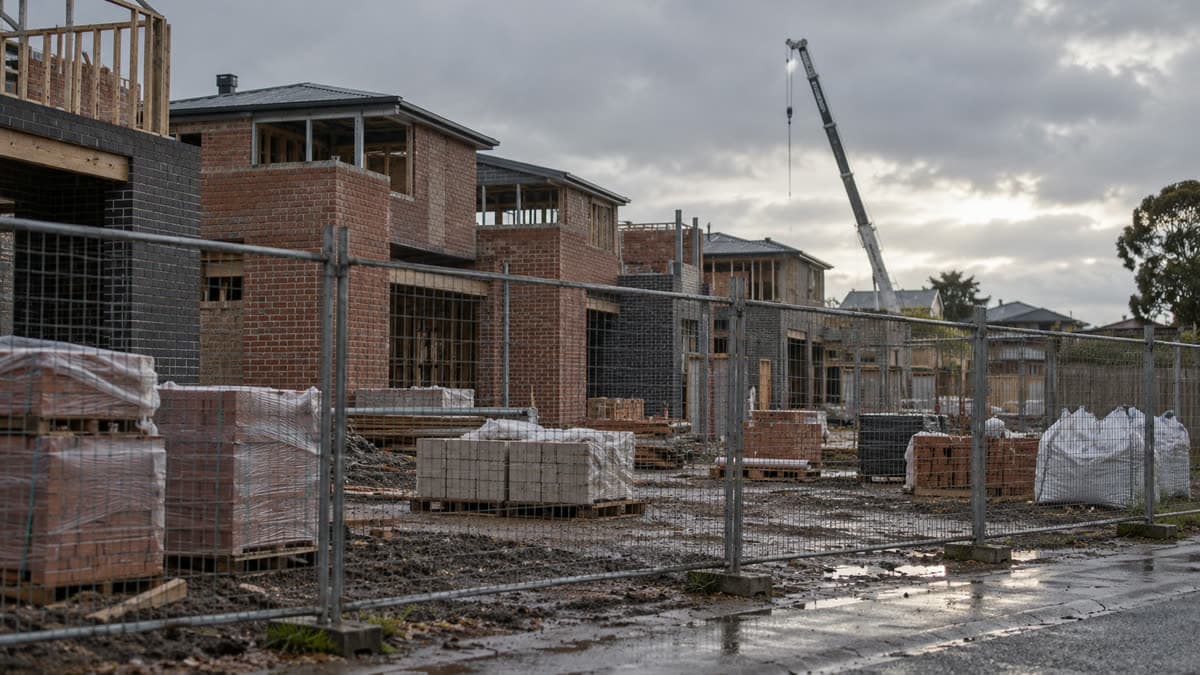
 Photo: SiteLogic editorial image
Insolvency
Construction insolvencies in Victoria: what ASIC data shows and why it lags rates
ASIC counts roughly a thousand Victorian construction companies entering external administration each financial year. This article reads the series, explains why it trails the cash rate by more than a year, and prices what a builder failure costs a developer.
Builders rarely fail on the day a rate rise lands. They fail when a fixed-price contract signed in a cheaper year meets the cost of finishing it. That delay makes insolvency data a poor early warning and a useful check on how much stress is already in the system.
What ASIC counts
ASIC publishes two series. Its information sheet on interpreting the statistics says Series 1 counts the first time a company enters external administration or has a controller appointed, and that ASIC prefers it for explaining trends in business failures. Series 1 and 2 are released weekly, two weeks in arrears. Industry follows the ANZSIC division, and the state is the company's principal place of business.
ASIC counts individual companies and does not aggregate groups. That matters for building, where a single developer can run dozens of project companies.
What the Victorian numbers show
The table sums ASIC's monthly Series 1 figures for companies with a Victorian principal place of business, from the workbook published on 28 September 2026. The sums are SiteLogic's own filter of the workbook's appointment-level data sheet: Series 1, construction division, Victorian principal place of business. ASIC does not publish this cross-tab as a table. The workbook holds data to 13 September 2026, and recent months are provisional. Later ASIC releases will have revised the most recent months.
| Financial year | Construction companies | All Victorian companies | Construction share | |---|---|---|---| | 2021-22 | 356 | 1,307 | 27.2% | | 2022-23 | 621 | 2,144 | 29.0% | | 2023-24 | 772 | 2,863 | 27.0% | | 2024-25 | 1,051 | 4,242 | 24.8% | | 2025-26 | 992 | 4,100 | 24.2% |
Victorian construction entries rose almost threefold between 2021-22 and 2024-25, then eased slightly in 2025-26. In July and August 2026 the count was 171, against 178 in the same two months of 2025. Victoria's August count was 85, inside the range of 51 to 120 it recorded in each month from September 2025.
Construction is not the only sector under strain. All Victorian entries rose 3.1 times between 2021-22 and 2025-26, from 1,307 to 4,100, and construction rose 2.8 times. Construction's share of the total fell from 29.0% in 2022-23 to 24.2%, so other industries rose faster. Weekly publication helps if you want to track the series, although the most recent weeks are provisional and get revised.
A note on the ASIC workbook limits what you can read from the national figures. It says August 2026 includes appointments involving 542 related companies that make up a large property development and construction group. ASIC says this materially affected the month, in particular the New South Wales and Construction industry results. The RBA's October Financial Stability Review says the recent administration of one large builder and developer will produce a temporary spike in September quarter insolvency figures because of the number of subsidiaries involved. That appears to be the same event. It also says the share of companies entering insolvency remains elevated against longer-term averages in sectors such as hospitality and construction, where conditions are hard, particularly for smaller firms, and that spillovers to the financial system have been contained.
Why it lags the cash rate
The RBA's cash rate table shows the last cycle. The cash rate rose from 0.10% to 0.35% on 4 May 2022 and reached 4.35% on 8 November 2023. It started falling on 19 February 2025.
Victorian construction entries kept rising after the final 2023 increase. They peaked in the year to June 2025, about 19 months after the last rise. Four mechanisms explain a lag of that length:
- A fixed-price contract signed before costs and rates rose locks in a margin that erodes over the build.
- Working capital buffers last for several quarters before they run out.
- Presale-funded projects continue while settlements look secure.
- Creditors and lenders tolerate late payment until a trigger event.
The cash rate rose by 100 basis points in 2026. The data above cannot say what that will do to builders. It only shows that the last cycle took more than a year to arrive.
Worked example: a builder fails at 60%
The following figures are illustrative. They demonstrate the method and will vary by site, council and timing.
A developer signs a $4,000,000 fixed-price contract. The builder fails when the work is 60% complete.
- Paid to date: $4,000,000 × 0.60 = $2,400,000.
- Remaining work: $1,600,000.
- A replacement builder prices the remainder at 10% above the original rate: $1,600,000 × 0.10 = $160,000 extra.
- The site stops for four months while the developer reviews defects, retenders and signs. Debt of $4,500,000 at 8.10% costs $4,500,000 × 0.0810 × 4 ÷ 12 = $121,500.
- Total additional cost: $160,000 + $121,500 = $281,500, which is 7.0% of the original contract.
The figure leaves out legal fees, defect rectification and the loss of any presale that lapses during the delay. It also assumes a lender continues to fund. The point is the scale. A builder failure can cost more than a 100 basis point rate rise on the same debt, which is $45,000 a year.
What to check
- Builder financials. Ask for recent accounts and look for thin equity or heavy dependence on one client.
- Group structure. Check which company signs the contract and how it relates to others in the group.
- Payment claims against progress. Pay for work completed and verify it against progress.
- Security. Confirm what retention, bank guarantee or insurance backs the contract.
- Recent filings. Search ASIC's registers for the builder and its directors before each major payment.
- Local context. The Vic development conditions panel tracks construction insolvencies by number against a year ago.
This is general information and not financial advice.
Published by the SiteLogic Editorial desk. Every fact traces to a primary source. See our standards and corrections register.
Fact-checked: 3 October 2026 · Review by: 3 January 2027
Sources: download.asic.gov.au · asic.gov.au · rba.gov.au · rba.gov.au
Was this useful? Try the tool this post is based on:
Pro on SiteLogic. Logi: up to 60 messages a day. Logi also stops at US$15 of model cost in a Melbourne calendar month. The Developer Comms Kit and unlimited saved projects. The Strategy Lab simulator runs without Pro. Saving a scenario needs a signed-in account. $60/month or $600/year, ex GST. First 3 months are $30/month, ex GST, on monthly Pro.